ATR-Forex.com Advanced Trading Resources |

|
|
|
Forex Glossary Index: A | B | C | D | E | F | G | H | I | K | L | M | N | O | P | Q | R | S | T | U | V | W | Y Technical Analysis: Candlestick Patterns for Forex TradingCandlestick Chart - A charting method first developed by the Japanese that shows price movements with candle-like graphs. On candlestick charts, a rectangle (called the body) represents the difference between the opening and the close prices. A single line, referred as the shadows or wicks, represents the high-low price range. If the open price is lower than the close, the body is white, green or not shaded; if the open price is higher than the close, the body is red, black or shaded.
Bearish Engulfing - Bearish engulfing is a chart pattern in candlestick charting describing the situation that a white (green or not shaded) candle is followed by a black (red or shaded) candle with a longer body in a upward trend. Bearish engulfing indicates a possible downward reversal for the price movement.
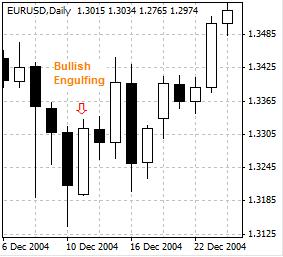
Bullish Engulfing – Bullish engulfing is a chart pattern in candlestick charting describing the situation that a black (red or shaded) candle is followed by a white (green or not shaded) candle with a longer body in a downward trend. Bullish engulfing indicates a possible reversal to the upside for the price movement.
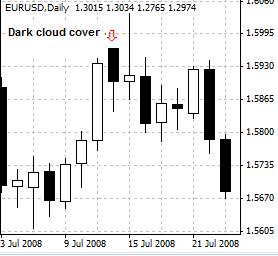
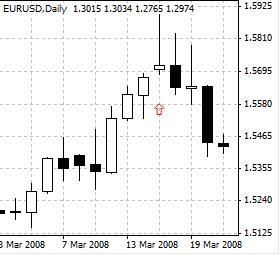
Dark Cloud Cover - A chart pattern in candlestick charting describing the situation that the price opens above the high but close below the range median of the previous period in an uptrend. On the chart it is a black (red or shaded) candle after series of white (green or not shaded) candles. A dark cloud cover is considered as a bearish reversal signal.
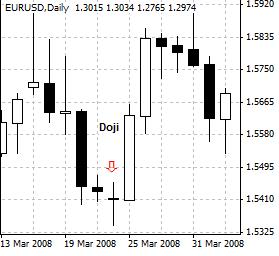
Doji - A candlestick chart pattern describing the situation that the open price and the close price are the same for a period.
Doji Stars - A candlestick chart pattern that consists of a doji candle gapping away from the body of the previous candle. There are so-called morning doji star and evening doji star.
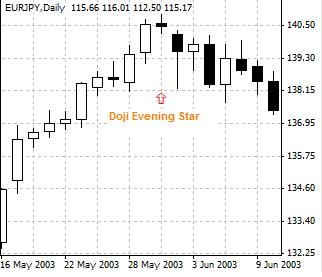
Evening Doji Star - A three-candle chart pattern for bearish reversal in candlestick charting. An evening doji star consists of a white (green or not shaded) candle, a second doji candle that rises higher than the first one, and a third black (red or shaded) candle that closes below the median of the first candle's body. See also morning doji star.
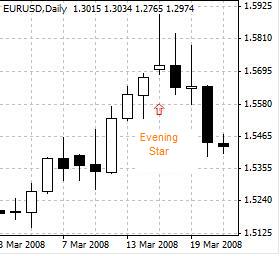
Evening Star - A three-candle chart pattern for bearish reversal in candlestick charting. An evening star consists of a white (green or not shaded) candle, a second candle (the star) that has a shorter body but rises higher than the first one, and a third black (red or shaded) candle that closes below the median of the first candle's body. See also morning star.
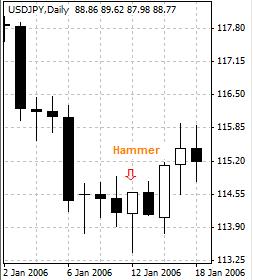
Hammer - A one-candle chart pattern for bullish reversal during a downward trend in candlestick charting. A hammer is a candle, no matter what color, that has a long lower shadow and a short body.
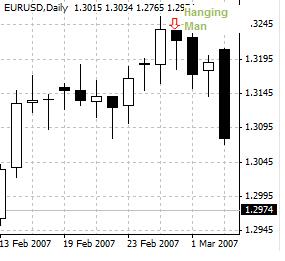
Hanging Man - A one-candle chart pattern for bearish reversal during an uptrend in candlestick charting. A hammer is a candle, no matter what color, that has a long lower shadow and a short body. It looks like a hammer, but it occurs in an uptrend whereas a hammer happens in a downward trend.
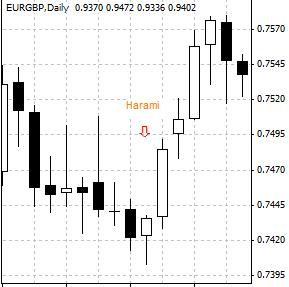
Harami - A price chart pattern of candlestick describing the situation that the shorter body of a candle is completely shadowed by the preceding candle's longer body of the opposite color. Harami often indicates a trend reversal.
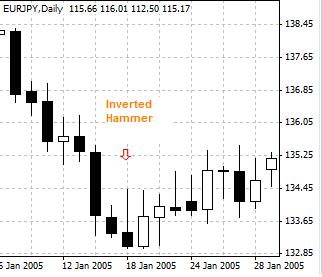
Inverted Hammer - A one-candle chart pattern for bullish reversal during a downward trend in candlestick charting. An inverted hammer is a candle, no matter what color, that has a long upper shadow and a short body.
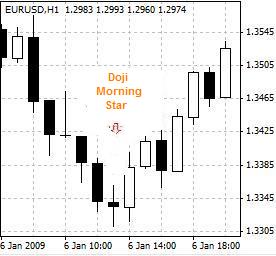
Morning Doji Star - A three-candle chart pattern for bullish reversal in candlestick charting. A morning doji star consists of a black (red or shaded) candle, a second doji candle that falls lower than the first one, and a third white (green or not shaded) candle that closes above the median of the first candle's body. See also evening doji star.
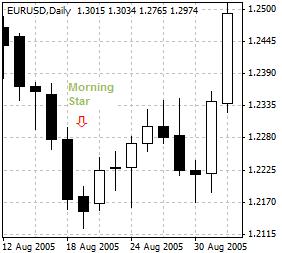
Morning Star - A three-candle chart pattern for bullish reversal in candlestick charting. An morning star consists of a black (red or shaded) candle, a second candle (the star) that has a shorter body but falls lower than the first one, and a third white (green or not shaded) candle that closes above the median of the first candle's body. See also evening star.
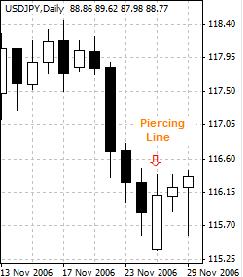
Piercing Line - A price chart pattern for bullish reversal during a downward trend in candlestick charting. A piercing line consists of a long black (red or shaded) candle, followed by a long white (green or not shaded) candle that opens blow the previous close but closes above the median of the previous candle's body.
Shooting Star - A candlestick chart pattern that consists of a candle with a short body and a long upper shadow. It occurs during an up trend and serves as a bearish warning.
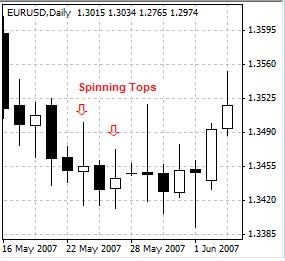
Spinning Top - A one-candle chart pattern in candlestick charting. A spinning top is a candle with a short body, relatively long upper and lower shadows. A spinning top often indicates indecisiveness during sideway price movement.
Stars - A candlestick chart pattern that consists of a candle with a short body gapping away from the body of the previous candle. There are so-called morning star and evening star.
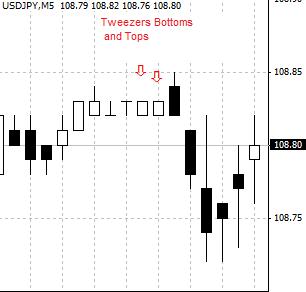
Tweezers Bottoms and Tops - A candlestick chart pattern that consists of two candles with almost the same high and low prices.
A | B | C | D | E | F | G | H | I | K | L | M | N | O | P | Q | R | S | T | U | V | W | Y |
| ©2008-2013 ATR-Forex.com. All Rights Reserved. | Home | About Us | Advertising | Site Map | Contact Us | Disclaimer | Risk Warning |