Forex Glossary Index:
A | B | C | D | E | F | G | H | I | K | L | M | N | O | P | Q | R | S | T | U | V | W | Y
Popular Technical Analysis Indicators
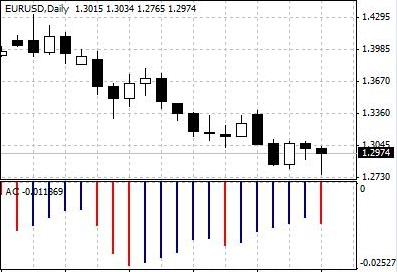
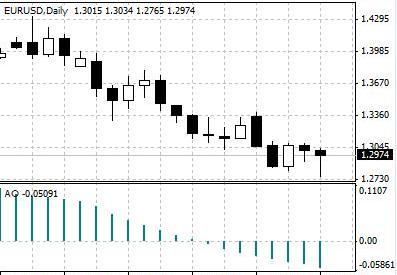
Accelerator/Decelerator Oscillator (AC) - A technical analysis indicator for identifying buying or selling opportunities. AC consists of a zero line and green/red indicator bars on the chart. If the current indicator bar is a green one above the zero line, it is a signal to buy. When the indicator current bar is a red one below the zero line, it is a signal to sell.
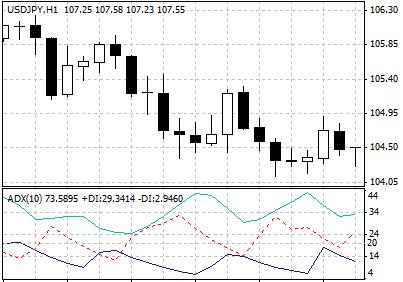
ADX - Average Directional Movement Index. ADX is a technical analysis indicator that measures the trend strength of the price movement of a currency pair.
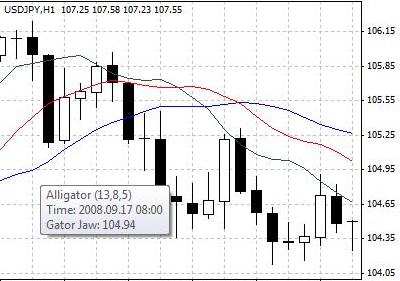
Alligator - A technical analysis indicator for identifying trend of price movement. An Alligator indicator consists of 3 smoothed moving averages (13-period, 8-period and 5-period moving averages that are moved 8 bars, 5 bars, and 3 bars into the future respectively), which are called the Lips, Teeth and Jaw of the Alligator. When the 3 lines are clearly apart, the market is in trend according to the Alligator. Closed or intertwined Lips, Teeth and Jaw indicate sideways market.
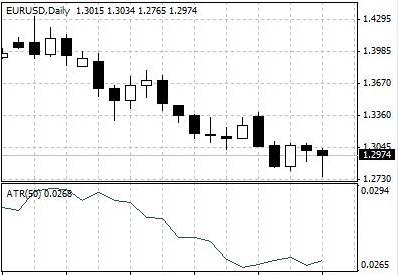
ATR - Average True Range. ATR is a technical analysis indicator developed by J. Welles Wilder for measuring volatility of price movement. The ATR is a moving average of the True Ranges, which is the current high less the current low, or the absolute value of the current high less the previous close, or the absolute value of the current low less the previous close, whichever is the greatest. Low ATR indicates low volatility and probably sideways price movement, while high ATR may indicates situations of panic buying or selling. Sometimes Average True Range is used as stop level in forex trading.
Average Directional Movement Index (ADX) - A technical analysis indicator that measures the trend strength of the price movement of a currency pair.
Average True Range (ATR) - Average True Range (ATR) is a technical analysis indicator developed by J. Welles Wilder for measuring volatility of price movement. The ATR is a moving average of the True Ranges, which is the current high less the current low, or the absolute value of the current high less the previous close, or the absolute value of the current low less the previous close, whichever is the greatest. Low ATR indicates low volatility and probably sideways price movement, while high ATR may indicates situations of panic buying or selling. Sometimes Average True Range is used as stop level in forex trading.
Awesome Oscillator (AO) - A technical analysis indicator for generating buying or selling signals. Awesome Oscillator (AO)indicator consists of a zero line and a green/red indicator on the chart. AO is calculated as subtracting the 34-period simple moving average from the 5-period simple moving average. When the green/red indicator crosses the zero line from below, a buy signal is generated. When the green/red indicator crosses the zero line from above, a sell signal is generated.
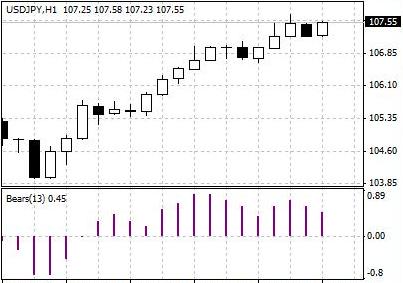
Bears Power - A technical analysis indicator for generating buying signals. The Bears Power indicator consists of a zero line and a Bears Power index on the chart. The Bears value is calculated as subtracting the 13-period exponential moving average from the lowest price. It is often used together with trend indicators such as moving averages.If the trend indicator indicates upward price movement while the Bears Power index is below zero but increasing in value, a buy signal is generated.
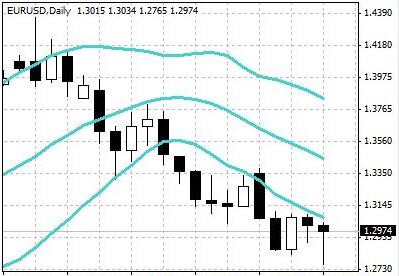
Bollinger Bands - Designed by John Bollinger in the early 1980's, Bollinger Bands are statistical measures of relative price highs and lows for a financial instrument. By definition, prices are high at the upper band and low at the lower band. In forex trading, Bollinger Bands are often used for pattern recognition, identification of support/resistance and reversal conditions, and systematic trading decisions.
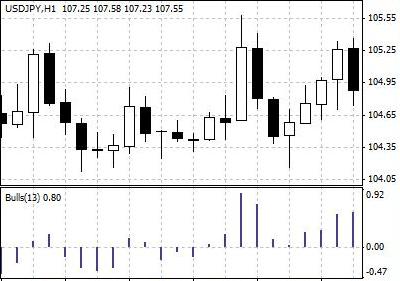
Bulls Power - A technical analysis indicator for generating selling signals. The Bulls Powerindicator consists of a zero line and indicator bars on the chart. The Bulls value is calculated as subtracting the 13-period exponential moving average from the highest price. Bulls Power is often used together with trend indicators such as moving averages. If the trend indicators indicate downward price movement while the Bulls Power index is above zero but declining, a sell signal is generated.
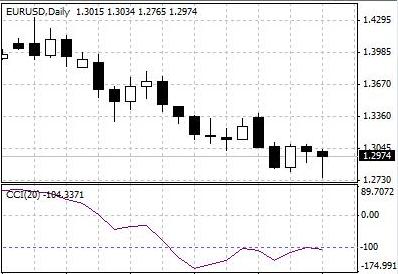
CCI – Commodity Channel Index. This technical analysis oscillator is typically used to signal over-bought or over-sold conditions in forex trading. It is calculated as the difference between the typical price and its simple moving average (MA), divided by the mean deviation (D): CCI = (Price - MA) / (0.015 * D). Readings above +100 or below -100 imply that prices are over-bought or over-sold.
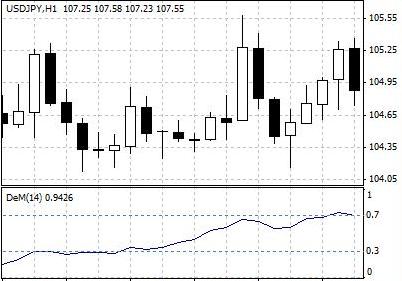
DeMarker - A technical analysis indicator for predicting price reversal. The Demarker indicator is based on the comparison of the maximum price of the current period with that of the previous period. A reading below 30 signals that a bullish price reversal would be expected, while a reading above 70 signals a possible bearish price reversal.
DMI - Directional Movement Index. A trend following indicator developed by J. Welles Wilder. A typical use of DMI is to buy when the +DI crosses above the -DI, or vice versa.
EMA – Exponential moving average. A moving average using a weighting factor known as exponential smoothing. With exponential moving average, today's smoothed average is calculated as the sum of the simple weighted average of today's price plus yesterday's smoothed average. Thus a gradually increased weight is given to more recent prices.
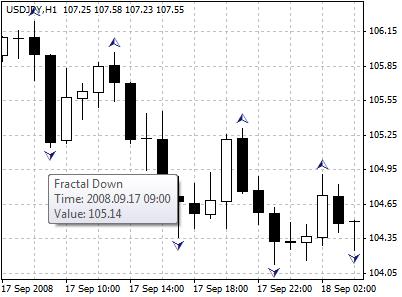
Fractals - A technical analysis indicator developed by Bill Williams for detecting price tops or bottoms. A fractal, identified with an up or down arrow on the chart, consists at least five successive bars, with the highest high in the middle and two lower highs on either side, or with the lowest low in the middle and two lows on either side.
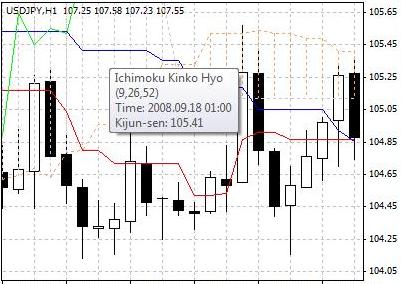
Ichimoku Kinko Hyo - A technical analysis indicator for detecting price trend, support and resistance levels and generating buying and selling signals. The Ichimoku Kinko Hyo indicator consists of Tenkan-sen, Kijun-sen, Senkou Span A, Senkou Span B, and Chinkou Span. The distance between the Senkou lines is called the "cloud", which indicates the the support and resistance levels. If prices are in the "cloud", the market is not trendy; otherwise there is a trend. A buying signal is generated when the Chinkou Span line traverses the price chart in the bottom-up direction, or the Tenkan-sen line crosses the Kijun-sen from below. A selling signal is generated when the Chinkou Span line traverses the price chart downward, or the Tenkan-sen line crosses the Kijun-sen from above.
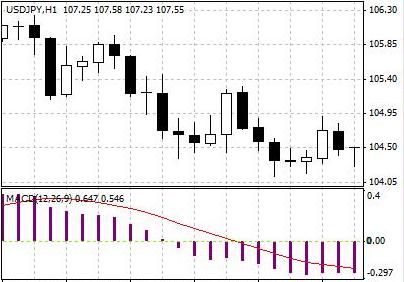
MACD - Moving Average Convergence Divergence. A popular technical analysis indicator using three moving averages for identifying overbought or oversold conditions in price movement.
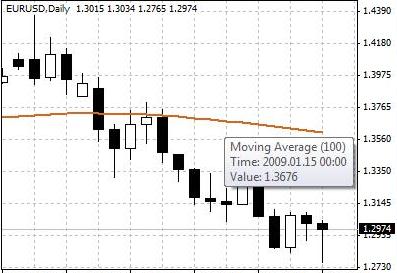
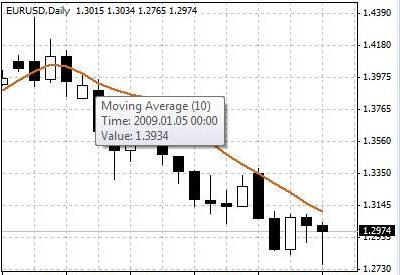
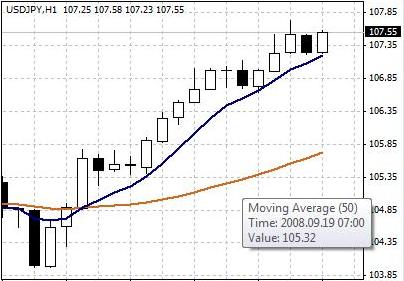
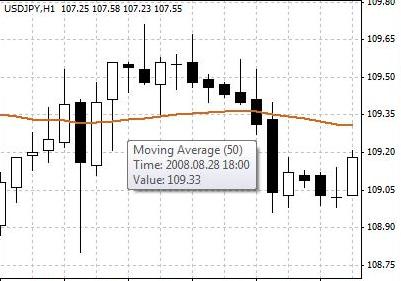
Moving Average - A technical analysis indicator for identifying trend in forex market. It is the mean of prices over a fixed period of time, for instance, the previous 10 trading days. Moving averages are usually classified by its calculation method into simple moving average, linearly weighted moving average, and exponentially smoothed moving average (EMA).
Moving Average Crossover - When a shorter-term moving average and a longer-term moving average cross each other. Moving average crossover are often considered as entry signals in technical analysis.
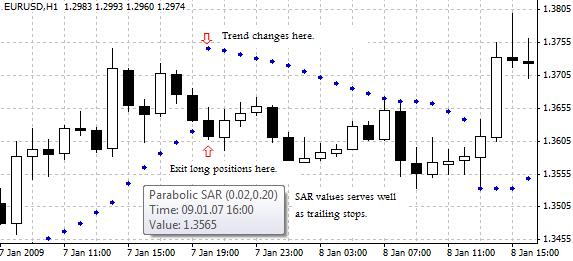
Parabolic SAR - A technical analysis indicator for identifying price trend and exit points. A stop-and-reversal (SAR) line is shown on the price chart; when prices are above the SAR line, it is bullish; when prices are below the SAR line, it is bearish. Long positions are supposed to be closed when the price breaks below the SAR line, while short positions are supposed to be closed when the price breaks above the SAR line. The SAR line is also often used for the purpose of trailing stop in forex trading.
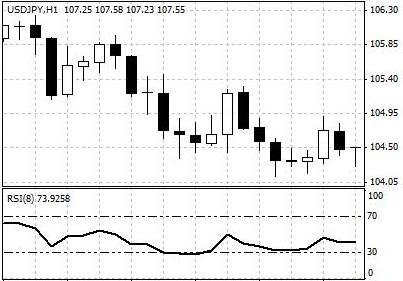
RSI (Relative Strength Index) - A technical analysis oscillator that measures the magnitude of upward price closes of a currency pair versus downward closes over a certain period on a scale of 0 to 100. A low RSI reading, usually below 30, indicates that a currency is oversold. Alternatively, a high RSI reading, usually above 70, indicates that a currency is overbought.
Simple Moving Average (SMA) - The equally-weighted mean price of a currency pair over a given period of time. For instance, the 10-day SMA of EUR/CAD is usually calculated by summing up each closing price of EUR/CAD during the 10 days, and then dividing the sum by 10. Simple moving average is a technical analysis indicator for identifying trend in the forex market.
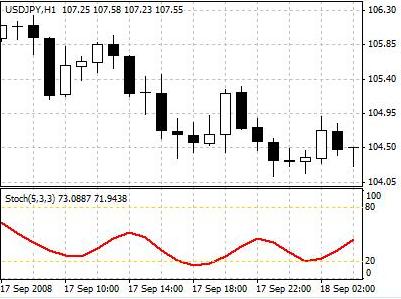
Stochastic - A technical analysis oscillator for identifying overbought or oversold conditions in price movement on a scale of 0 to 100. It is derived by comparing closing prices to the price range of a certain time frame. A Stochastic reading above 80 is generally regarded as oversold, while a reading lower than 20 is regarded as overbought.
Weighted Moving Average (WMA) - The mean of prices over a given period with greater weight given to the latest price. For example, with a 3-day WMA of EUR/NZD, today's price might be assigned a factor of 3, yesterday's price a factor of 2, and the day before yesterday's price a factor of 1. This type of weighted moving average is also known as linearly weighted moving average or simple weighted moving average.
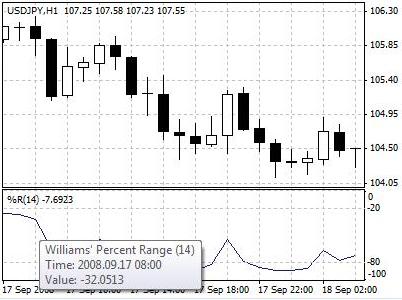
Williams' Percent Range - A technical analysis indicator for detecting overbought or oversold conditions of price movement. A reading above 80% indicates an oversold market, while a reading below 20% indicates an overbought market.
Site Index:
A | B | C | D | E | F | G | H | I | K | L | M | N | O | P | Q | R | S | T | U | V | W | Y
|
